Coal, allegedly for steelmaking, in the twenty-first century
The Tenas Project's output is metallurgical coal, sold to steelmakers. This is what that market actually looks like as hydrogen-reduced iron begins commercial shipment.
Iron and steel today
Coal is genuinely coupled to primary steelmaking today. In a blast furnace, coke is both the fuel and the reductant that pulls oxygen out of iron ore. That is the physical fact the industry points at when it justifies new metallurgical-coal mines.
Figures: IEA Iron and Steel Technology Roadmap.
The claim the industry makes
The proponents of new coking-coal mines — including Telkwa Mining Limited on the Tenas Project — argue that metallurgical coal is materially different from thermal coal burned for power. Steel, the argument goes, is essential to modern life (buildings, wind turbines, hospitals, railways) and cannot be made without coking coal, so blocking a new coking-coal mine only shifts the same demand to another jurisdiction, most likely with weaker environmental standards.
The framing has real teeth in the short term. It is also the industry's core answer to climate-based opposition: the coal we mine, the argument runs, is inherently different from the coal you should be worried about.
What the physical reality actually is
Around 70 % of the world's crude steel is produced through the blast furnace – basic oxygen furnace (BF–BOF) route. Every tonne of steel through that route consumes roughly 0.6 tonnes of metallurgical coke, plus injection coal — in total on the order of 700 kg of coal per tonne of primary steel.
The remaining ~30 % comes from electric arc furnaces (EAF), which melt scrap and (increasingly) direct-reduced iron using electricity. In the United States, EAF is already about 70 % of production; in China, still under 15 %. Scrap availability, iron-ore reserves, and grid carbon intensity dictate the mix regionally.
The direct-reduced iron (DRI) itself has historically been produced with natural gas as the reductant (mostly in the Middle East and North Africa). What is new in the last decade is DRI using hydrogen as the reductant, producing water instead of CO⊂2 — the technology that turns "green steel" from a slide-deck term into an actual shipping product.
Where the industry is actually going
Coal-free primary steelmaking is not a future paper study. It is being built, and in some cases already ships steel to named customers:
- HYBRIT (Sweden, joint venture SSAB · LKAB · Vattenfall). Pilot plant in Luleå from 2020. First fossil-free hydrogen-reduced steel delivered to Volvo AB in 2021. Commercial demonstration plant under construction in Gällivare, targeting first commercial steel this decade.
- Stegra (formerly H2 Green Steel), Boden, Sweden. Greenfield hydrogen-DRI + EAF plant, 5 Mt/year target capacity, first steel targeted 2026–27. Multi-billion-euro financing closed. Named offtakes with Mercedes-Benz, BMW, Scania, Miele, ZF, and others.
- ArcelorMittal. Hydrogen-DRI conversions announced or in construction at multiple European sites (Hamburg, Bremen, Ghent, Dunkirk, Gijón), each in the 2–3 Mt/year range, targeting 2026–2030.
- thyssenkrupp Duisburg (Germany). Existing blast furnaces being replaced by a DRI-EAF plant (2.5 Mt/year), commissioning targeted mid-decade.
- Salzgitter SALCOS (Germany). DRI/EAF conversion of the Salzgitter integrated works, first module targeting 2026.
- POSCO HyREX (South Korea). Hydrogen-based fluidized-bed reduction; pilot underway, commercial deployment targeted 2030s.
- Boston Metal (US). Molten oxide electrolysis — single-step ore-to-liquid-iron with electricity only. Pilot in Woburn, Massachusetts; commercial deployment targeted from 2026.
These are not fringe projects. They are the plans of the top-five European steelmakers and the world's third-largest producer, backed by the EU Green Deal Industrial Plan, the US Inflation Reduction Act, and Sweden's grid buildout. The EU Carbon Border Adjustment Mechanism, phasing in through 2026, prices imported blast-furnace steel's embedded carbon at the EU border — steadily changing the competitiveness of coal-based steel exports into the EU market.
The Tenas Project's market
The Tenas Project is proposed to produce approximately 825,000 tonnes per year of metallurgical (coking) coal over a mine life on the order of 25 years, with target markets in Asian steelmaking. The operator, Telkwa Mining Limited, is associated with Bathurst Resources (New Zealand), per branding on the proponent's own recent public material.
Bathurst is a mid-size coal miner best known for coking coal in New Zealand and Australia. Its business case for Tenas rests on Asian mills continuing to buy imported coking coal through the 2030s and 2040s. That case runs against the direction of published policy and named commercial deployments in that same window — and, per IEA analysis, against the sector's own available carbon budget:
If operated until the end of their typical lifetime under current conditions, these and other assets in the steel industry could lead to around 65 Gt CO⊂2 of cumulative emissions. This would exhaust most of the CO⊂2 budget compatible with a sustainable transition for the sector. — IEA, Iron and Steel Technology Roadmap
The question the record forces is not whether steel can be made without coal — that's now a matter of shipped product — but how many decades of Asian blast-furnace demand a greenfield Canadian coking-coal mine, permitted in the late 2020s, is actually being planned against.
What the record says about the coal itself
Rank and formation. Petrographic analysis across the 1989, 2018 and 2019 drill programs places the Tenas coal at medium-to-high volatile bituminous A, with maximum vitrinite reflectance between 0.89 and 1.29 (averaging 0.96). The four seams of economic interest sit in the Seam 1 sequence of Unit 1, deposited in a nearshore-marine, tidal-flat, coastal-swamp environment that later saw restricted marine incursions — the proponent's stated geological explanation for the elevated sulfur content between seams (Section 1.8.2.4, EAC Application Overview, Part A, May 2022).
The regulator's direct challenge. The Working Group Issues Tracking Table (rounds of December 2022 and April 2024) records this exchange:
The coal deposit contains 2% sulphur and 20% ash. Both of these appear to be double the specification for metallurgical coal. Please explain how the project meets the definition of a metallurgical coal mine. — Working Group Issues Tracking Table, Item S1 / Coal quality
The proponent's response. Telkwa Mining answered that the 2 % sulphur / 20 % ash values are pre-processing (in-situ) figures from Table 1.8-4 of the EAC Application, and that after washing at the on-site Coal Handling and Preparation Plant, “post-processed coal quality produces an average ash of <10.0% on an air-dried basis.” The response speaks to ash but, as recorded in the tracker excerpt, does not report a post-wash sulfur figure — a fact worth noting because organic sulfur (a substantial portion of Tenas coal sulfur, per the depositional history above) cannot be reduced by density-based washing.
Processing. The Coal Handling and Preparation Plant is designed for 145 t/h of run-of-mine coal producing 110 t/h of clean coal, via a two- or three-stage circuit (heavy-media cyclones for coarse ROM, reflux classifier for middlings, froth flotation for fines). Total washed product over the mine life: ~16.5 Mt (2022 update; the 2018 Project Description gave 15.0 Mt).
Product mix and its labelling. The proponent's submissions target the product as blending coal for coke production and as a “heating agent” in blast-furnace steelmaking. A public submission to the EAC by the Northwest Institute observes that the project defines “seaborne metallurgical coal” as encompassing hard coking coal (HCC), semi-soft coking coal (SSCC), and PCI (pulverised coal injection) coal — a spectrum that includes grades used as combustion fuel inside the blast furnace rather than as chemical reductant. The metallurgical/thermal boundary is softer in market practice than in the framing of “coal for steel.”
Direct GHG. Telkwa Mining's atmospheric-environment volume estimates project GHG emissions of 68,973 t CO2e/year at Year 5 of operations — the largest sources being fuel combustion in mobile mine equipment and fugitive coalbed methane releases, using an ECCC-standard emission factor of 0.86 kg CH4 per tonne of coal mined for surface bituminous coal in BC. A separate public submission by Mark Chernaik, applying methane-resource assumptions specific to the Telkwa coalfield (Ryan 1993), calculated coalbed methane emissions of 92,546 t CO2e/year — bringing total direct project emissions to about 139,000 t CO2e/year in that alternate calculation. Both figures exclude the downstream emissions from combusting the coal itself.
The 1985 Bustard aquatic-environment assessment for the earlier Telkwa Coal Project already flagged “the potential for acid mine drainage and associated heavy metal mobilization in surface water” — a hazard track that reappears in the current EAC file in Appendix 17 (Metal Leaching / Acid Rock Drainage Management Plan, SRK) and in the multiple sulfide-classification protocols now applied to the pit and waste-rock piles.
Where the coal lies
The company drew this map of the Telkwa coalfield in October 2022. The stippled brown area is the coal field as the company draws it: it runs under the valley floor from north of Smithers to south of Telkwa. The purple squares are the company’s coal licences, and the green squares are land it owns. The orange shape is the Tenas Project.
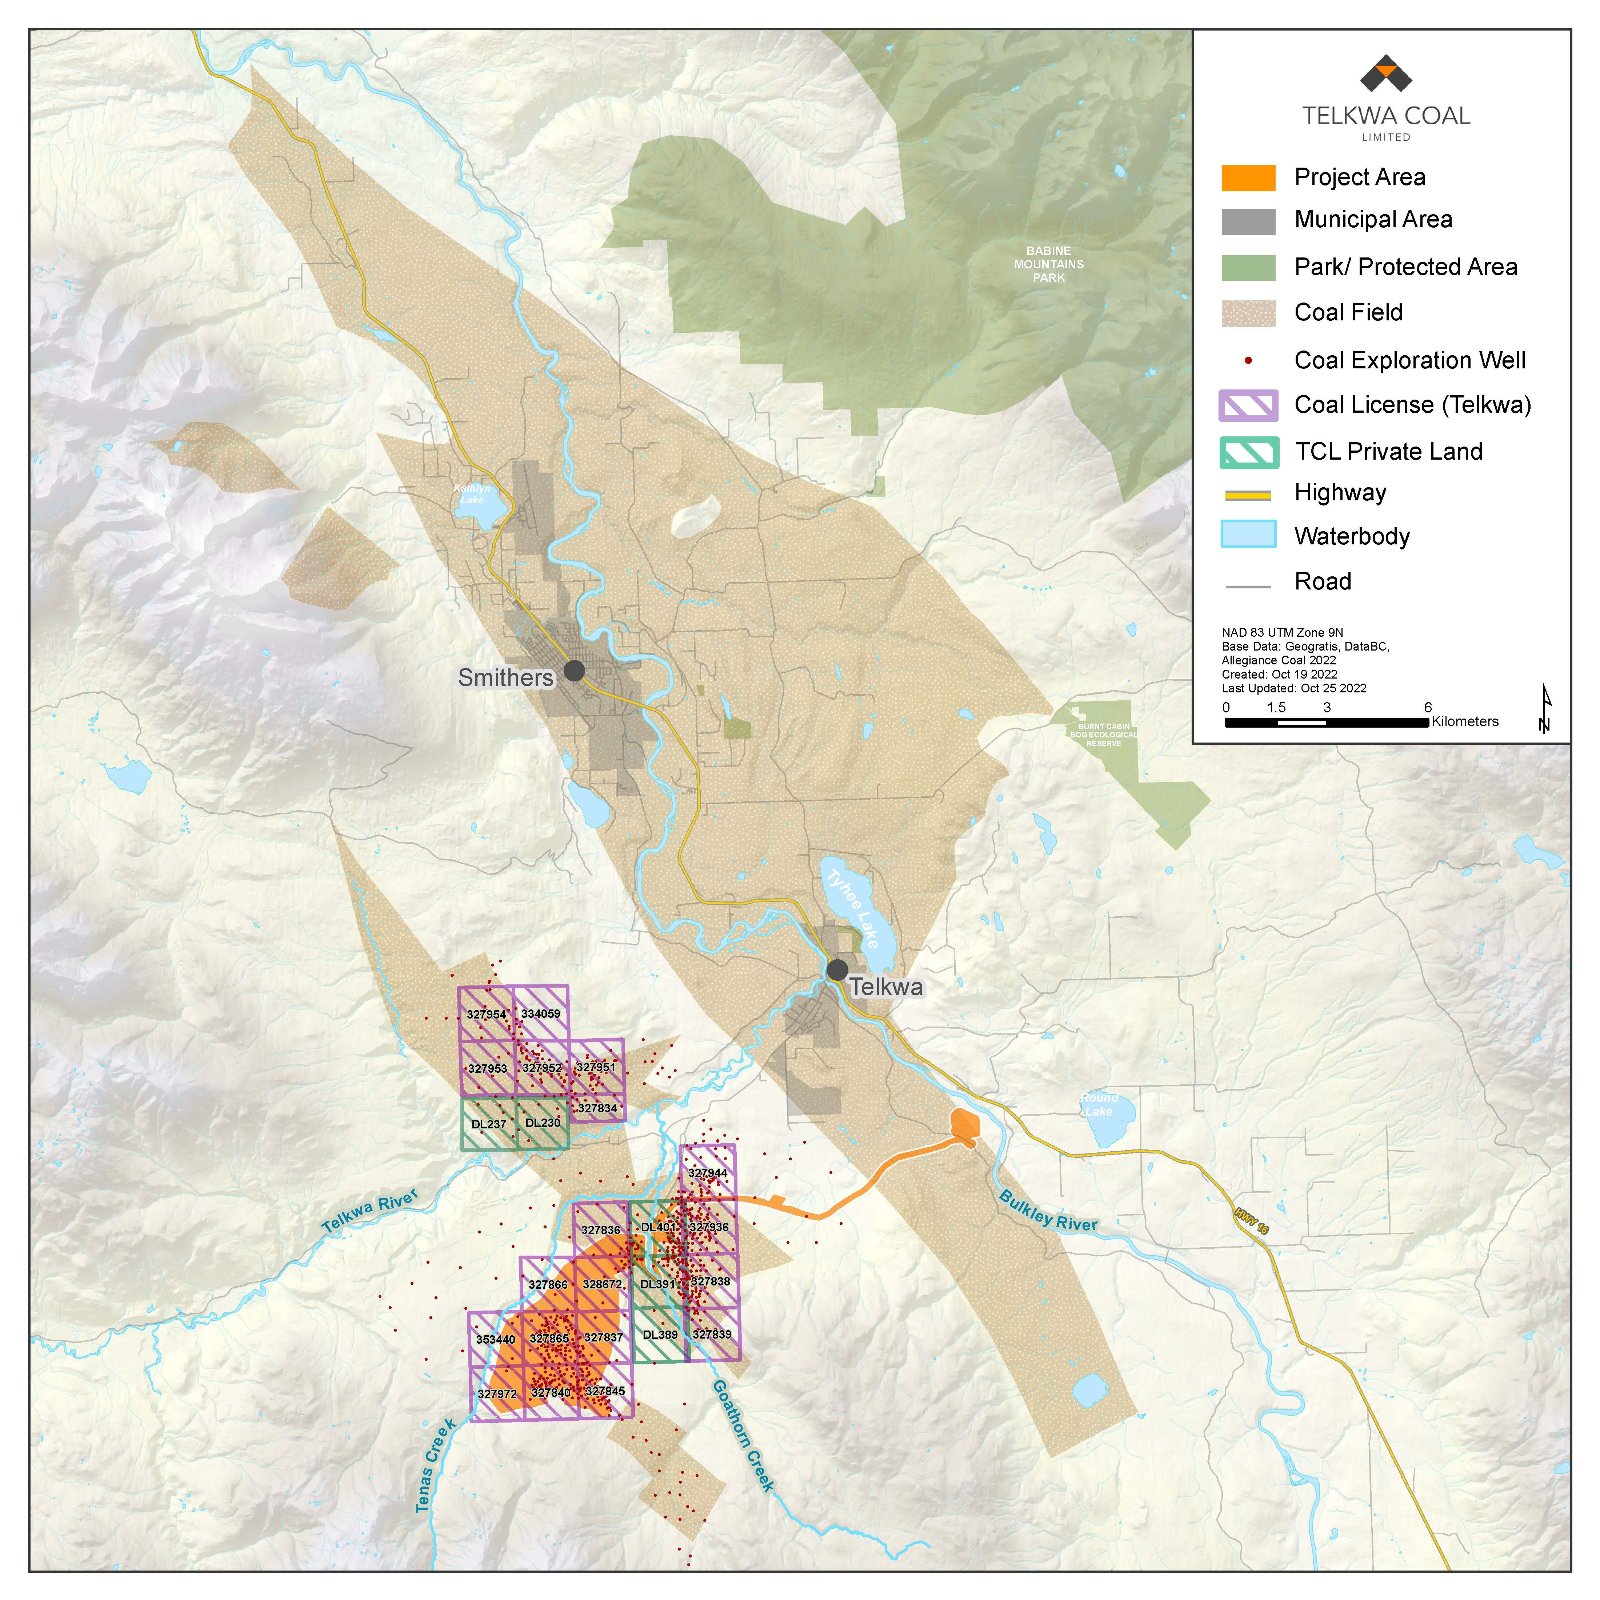
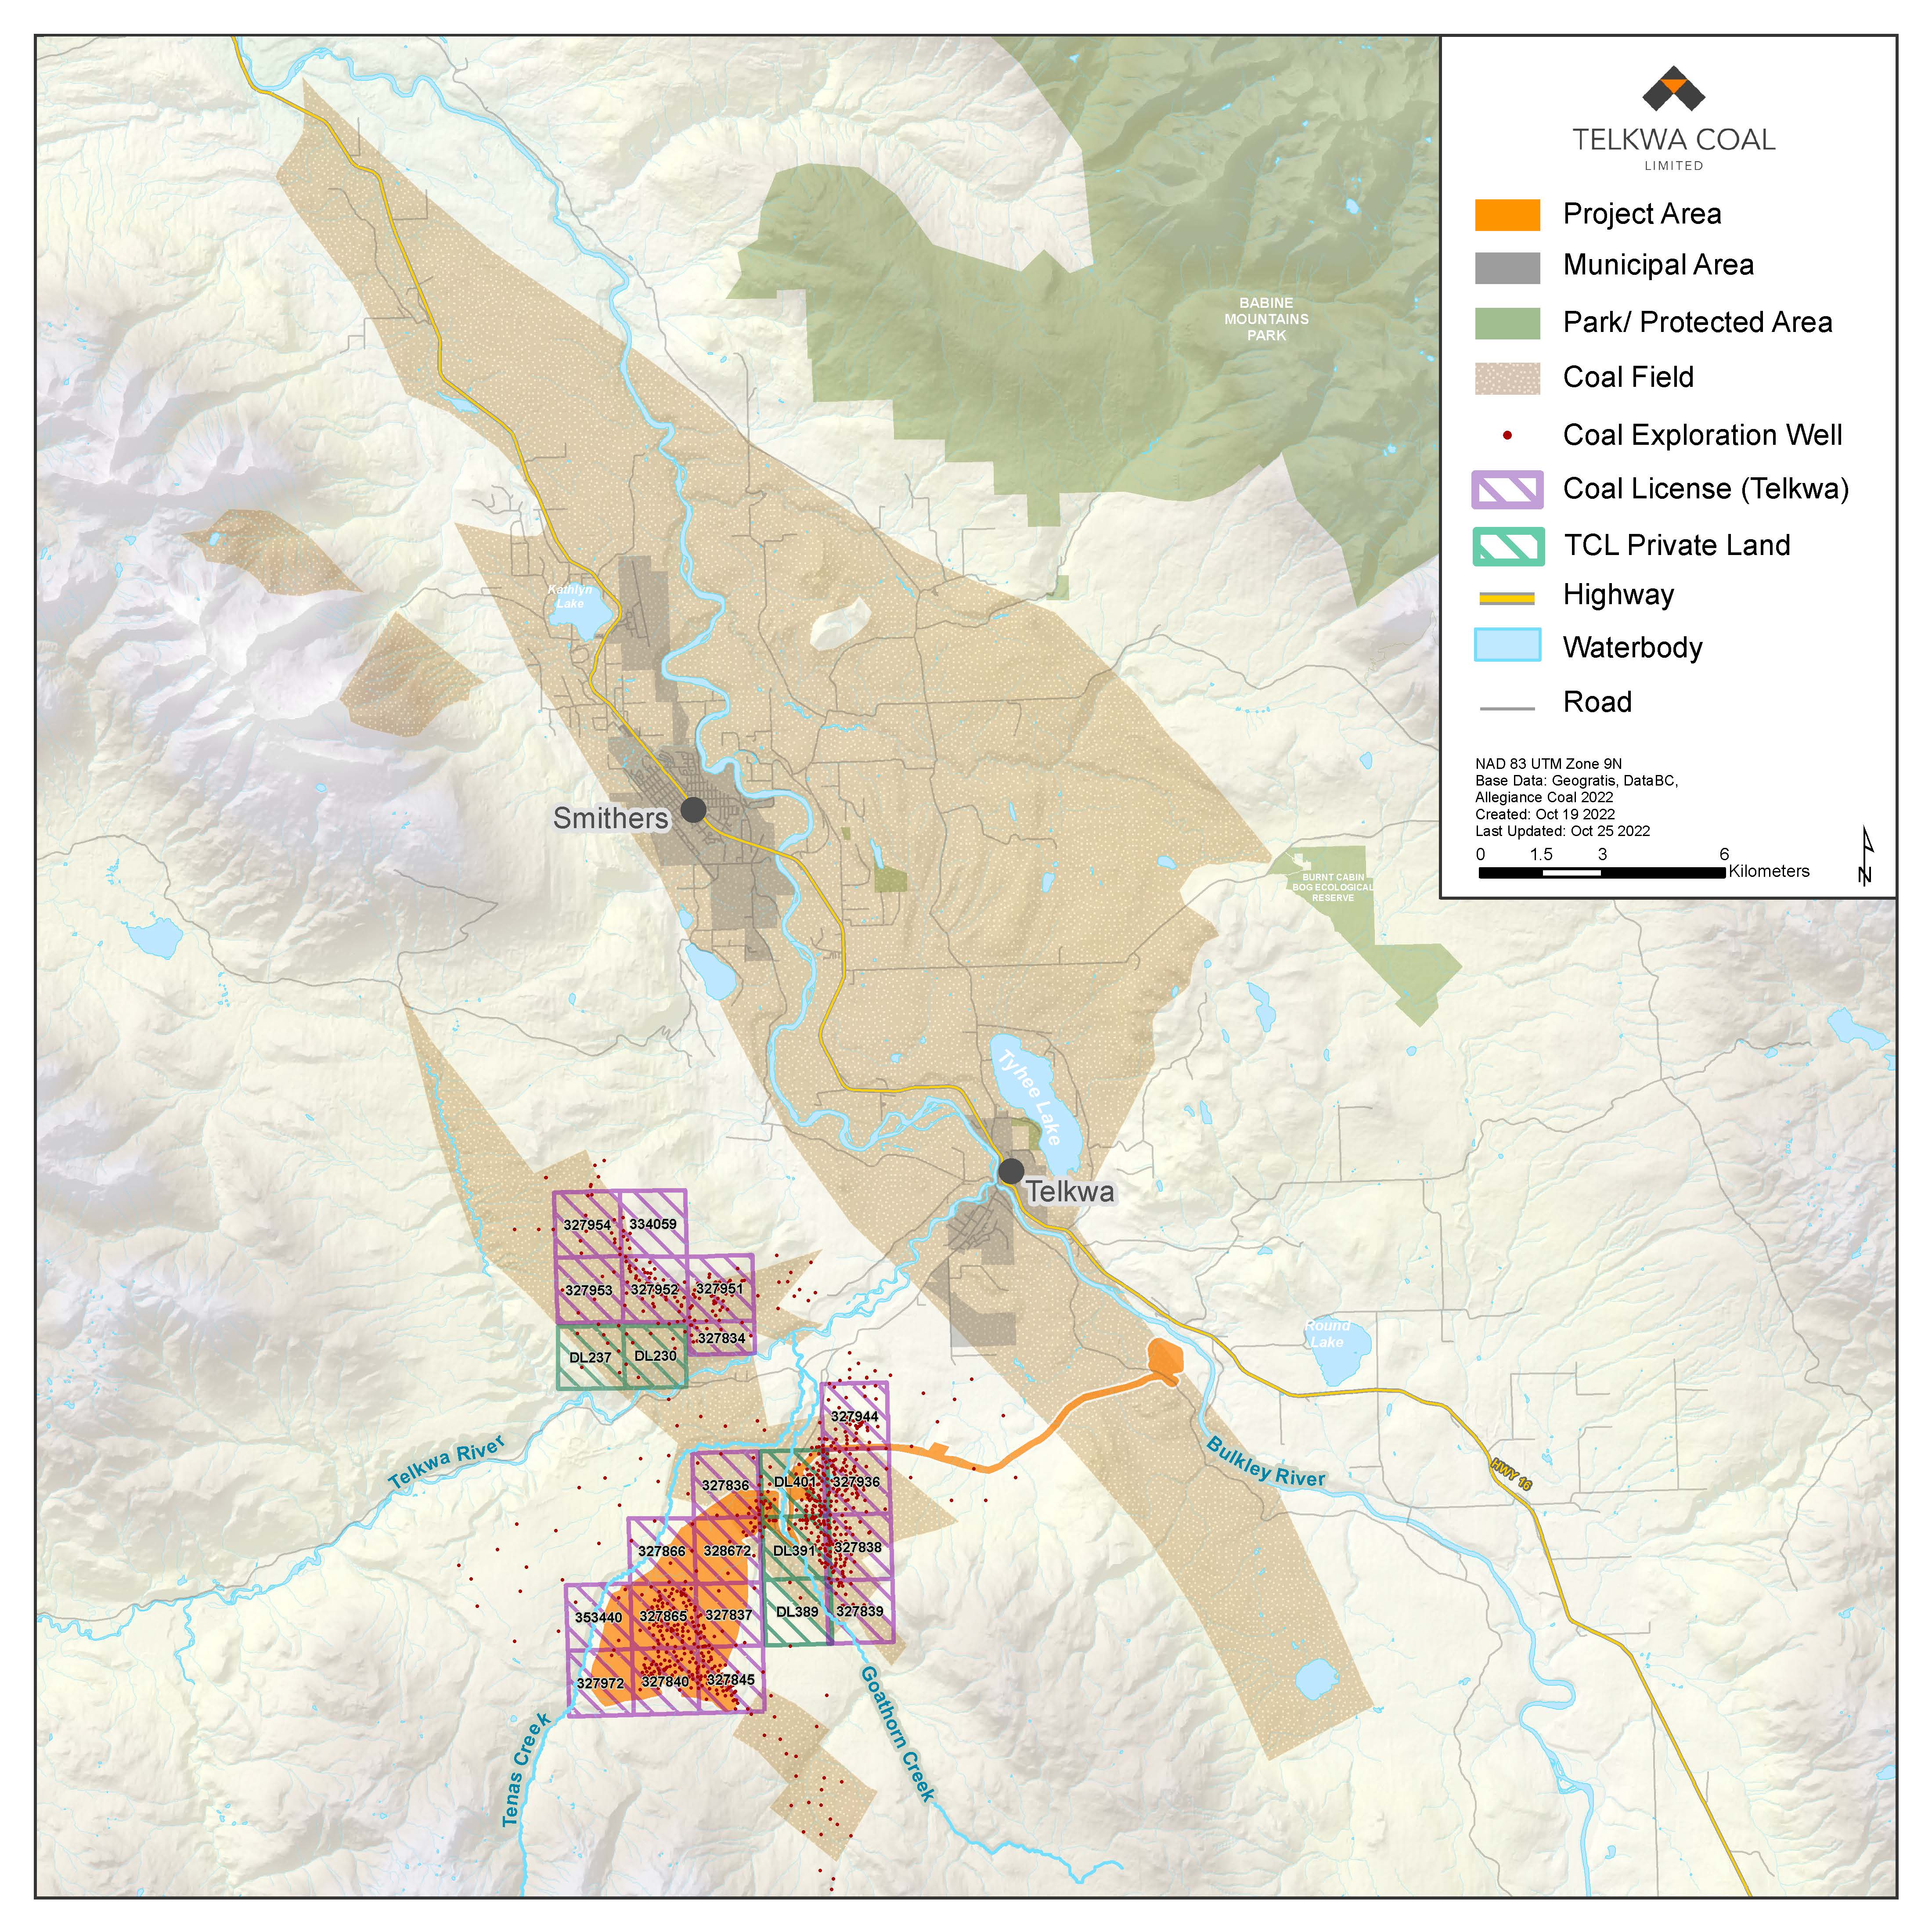
The licences fall in two blocks. One block surrounds the Tenas pit. The other lies north of the Telkwa River, outside the Project Area. By our count the map prints 19 licence numbers, six of them in the northern block, and five parcels of company land.
See this map laid over the 3D terrain →
Three limits apply. The licence numbers are as the company printed them in October 2022; we have not checked them against the provincial registry, so their standing today is unverified. The “coal field” is the extent the company drew. It is not an estimate of coal that can be mined. On the 3D map the picture sits within about 75 metres of its true position.
How much coal there is
The record measures the coal at four scales, and each scale is smaller than the one before it. The coalfield holds coal in the ground. A resource is the part of it that drilling has outlined well enough to count. A reserve is the part of the resource that the company's mine plan would dig. The saleable coal is what leaves the washing plant.
| Telkwa coalfield, eight areas around the Telkwa River, in place (Ryan, provincial Geological Survey, 1993) | 853 Mt |
|---|---|
| Ryan's Area 4, where the Tenas pit lies, in place | 68.6 Mt |
| Tenas resource, measured and indicated, 31 December 2021 | 36.6 Mt |
| Tenas reserve, run-of-mine coal, proven and probable | 22.0 Mt |
| Tenas saleable coal after washing | 16.3 Mt |
| Tenas output per year | 0.78–0.83 Mt |
| All coal mined near Telkwa, 1918–1985 | about 0.4 Mt |
Mt is million tonnes. Sources: Ryan's figures come from his Table 1 as reproduced in a public submission (Lebiadowski, July 2022, p. 4). The Tenas resource is from Application Part A, p. 106, and the reserve and saleable coal from p. 47. The output figure is from the company's answer to the Office of the Wet’suwet’en (tracking table, p. 30). The historic production is from Appendix 1-Q, p. 3.
The Tenas reserve. The company counts 17.1 Mt of proven and 4.9 Mt of probable run-of-mine coal. Its plant would wash that to 16.3 Mt of saleable coal, a yield of 73.9 percent. To reach it, the pit moves 3.75 bank cubic metres of overburden and rock for each tonne of raw coal. At about 0.8 Mt a year, 16.3 Mt lasts about twenty years.
A discrepancy in the Application. Application text states that “most of the coal in the Project is of sufficient drill density and shallow depth to be classified as a Measured Resource.” The table beneath it (Table 1.8-8) gives 8.7 Mt measured and 27.9 Mt indicated. By the table, less than a quarter of the resource is measured.
The rest of the coalfield. The company holds two more deposits, Goathorn and Telkwa North. In 2020 the Office of the Wet’suwet’en asked about the company's plans for them. The company answered: “We have no plans to develop either the Goathorn or Telkwa North deposits, or any other coal deposits, within our tenure across the Telkwa coalfield, during the mine life of the Tenas Project.” Ryan's 1993 survey puts 670 Mt in his Area 5, which takes in the ground of both deposits. That is ten times the coal of the Tenas area.
How the figures differ. The 2021 Tenas figures follow the national reporting rule for mineral projects (National Instrument 43-101) and the Australian rule (JORC). Ryan's 1993 figures use the federal coal classification of 1988. They estimate coal in the ground and do not claim it can be mined. Ryan's area table comes to the site second-hand, through a public submission. We have checked that the submission's sums add up, but we have not seen Ryan's original paper.
Map of the coal areas
Click a marker to read what the record says about that place, with links to the pages. The red markers are the company's three deposits. The numbered circles are Ryan's 1993 areas, labelled with the coal each holds. The black markers are abandoned underground mines.
There are two kinds of position on this map. The Tenas pit outline comes from the company's site plan. The other markers are placed by matching two maps against known landmarks. One is Ryan's sketch map, as reproduced in the submission (p. 3). The other is the company's coalfield figure 21-2. Those markers are good to about a kilometre, and they show which area is where, not where its edges run.
By the numbers
| Global sector CO2 | ~2.6 Gt / year |
|---|---|
| Sector share of energy-system emissions | ~7 % |
| Coal share of sector energy demand | ~75 % |
| Coking coal per tonne of BF–BOF steel | ~0.7 t (coke + injection coal) |
| Share of steel via blast furnace – oxygen furnace | ~70 % globally |
| Share via electric arc furnace | ~30 % globally (~70 % in the US) |
| Hydrogen-DRI share by 2050, IEA Sustainable Development Scenario | ~15 % of primary steel |
| Cumulative CO2 if existing sector assets run to end-of-life | ~65 Gt |
| Tenas Project proposed annual output (coking coal) | ~825,000 t / year |
| Tenas Project mine life | ~25 years including reclamation |
| Tenas insitu (pre-wash) sulphur | ~2 % (adb) |
| Tenas insitu (pre-wash) ash | ~20 % (adb) |
| Tenas post-wash ash target | <10 % (adb) |
| Tenas post-wash sulphur, in the EAC record excerpt reviewed | not reported |
| Tenas coal rank | medium-to-high volatile bituminous A |
| Vitrinite reflectance (max, mean) | 0.96 (range 0.89–1.29) |
| CBM emission factor (ECCC BC surface bituminous) | 0.86 kg CH4 / t coal mined |
| Direct project GHG at Year 5 (proponent estimate) | ~69 kt CO2e / year |
| Direct project GHG with Chernaik CBM re-estimate | ~139 kt CO2e / year |
Voices in the record
Coal is used to generate heat and to make coke, which is instrumental in the chemical reactions necessary to produce steel from iron ore. — IEA, Iron and Steel Technology Roadmap
Hydrogen and CCUS together account for around one-quarter of the cumulative emission reductions. — IEA, Iron and Steel Technology Roadmap, on the sector's Sustainable Development Scenario
- International Energy Agency. Iron and Steel Technology Roadmap. iea.org/reports/iron-and-steel-technology-roadmap
- International Energy Agency. Tracking Clean Energy Progress – Iron and Steel. iea.org/energy-system/industry/steel
- Wikipedia contributors. Green steel. en.wikipedia.org/wiki/Green_steel (accessed 2026).
- Telkwa Mining Limited. Caribou public information sheet (Tenas Project) — contains the proponent's own current corporate branding (Bathurst). telkwa-mining.ca — caribou info sheet
- Telkwa Coal Limited. EAC Application Overview, Section 1.8 — Geology and Coal Quality (May 2022, Part A) — source of the in-situ quality, seam geology and vitrinite reflectance figures.
- Telkwa Coal Limited. Coal Processing Plant Technical Information, App 01.0-N (Oct 2018) — CPP capacity, product-quality control and stockpile-blending detail.
- BC EAO Working Group. Master Tenas App Review WG Issues Tracking Table — Round 2 (15 Dec 2022) and the WG Issues Tracking Table update (10 Apr 2024) — source of the “how does this meet the definition of a metallurgical coal mine” challenge and the proponent's response.
- Telkwa Coal Limited / SRK. Metal Leaching / Acid Rock Drainage Management Plan (App 17 of the July 2026 Water IR Response, Part 7) — sulfide speciation, geology of Unit III.
- Telkwa Coal Limited. Atmospheric Environment Valued Component, App 04.1 (May 2022) — direct-GHG estimates and CBM emission factor.
- Mark Chernaik. GHG report from MC 2 w total methane (public submission) — alternate CBM calculation.
- Northwest Institute. Submission on the Tenas Project — independent commentary on the “metallurgical coal” label as applied.
- Bustard. Aquatic assessment for the earlier Telkwa Coal Project (1985) — initial ARD flag.